> For the complete documentation index, see [llms.txt](https://docs.inspector.dev/llms.txt). Markdown versions of documentation pages are available by appending `.md` to page URLs; this page is available as [Markdown](https://docs.inspector.dev/guides/laravel/group-by-service-name.md).
# Group by service name
Monitor your Laravel application by service name instead of single hostname.
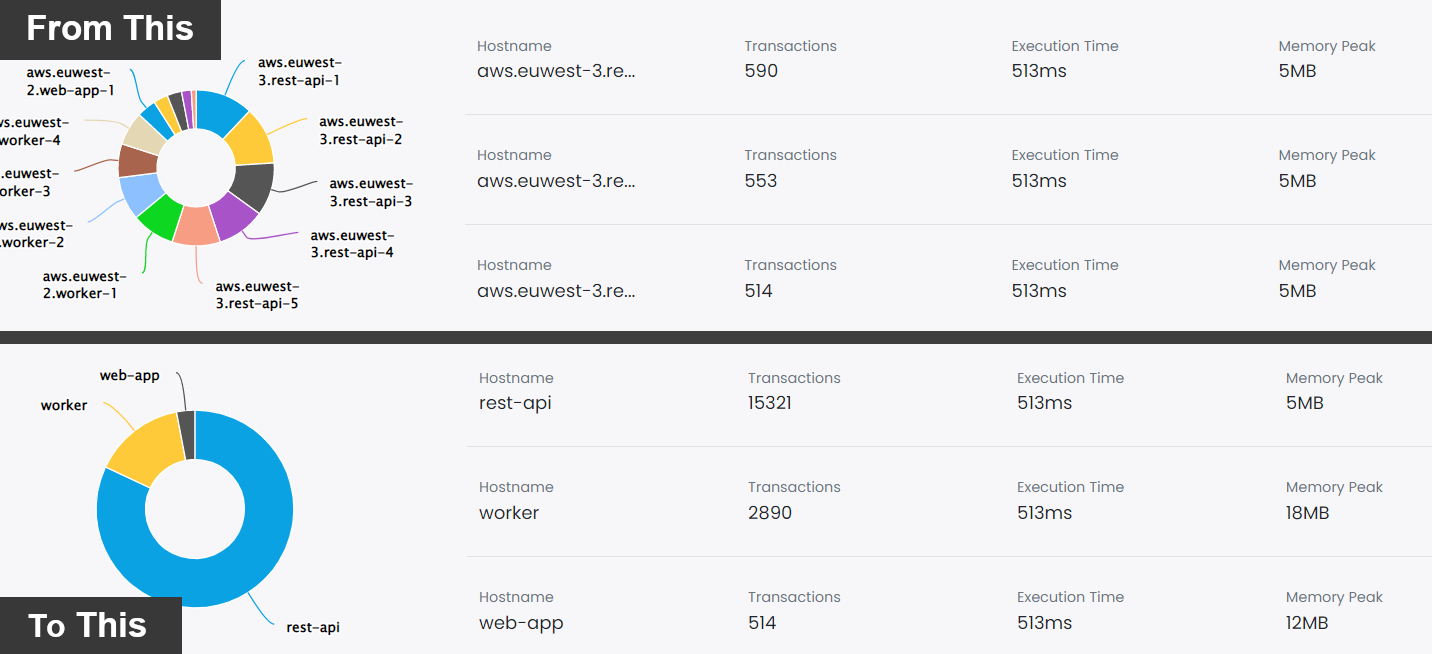
Inspector segments metrics by hostnames. So as the number of underlying hosts increase it could create a bit of clutter in the charts.
It may be more clear to use a human friendly **service name** to represent all your servers inside the same logical group.
We can use the Inspector library to programmatically change the hostname just before the transaction is sent out of your server and set the same for related instances. It will make your dashboard more clear and understandable.
{% hint style="info" %}
Read the step by step guide on our blog:
{% endhint %}